Daniel Guzman
Alejandro Rodriguez
March 13, 2017
In this lab, we are trying to figure out the relationship of force of air resistance force and the speed at which the object.
We start off this lab by going to the Design Technology building, where someone will drop the coffee filters from the balcony from 1 filter until 6 filter.
Every time the person at the balcony drop a filter, we use the video capture function on the Logger Pro Program and record the coffee filter falling. We then measured the distance where it traveled which in this case was two distances, one from top of the balcony to the very bottom of the balcony, and then the distance from the balcony to the ground.
We use these as reference scale and set it so on the Logger Pro, and later mark where the coffee filter goes every 3 frames and from that we can get our force and our velocity. By doing a linear fit on the graph, we can determine our terminal velocity for the coffee filter and we can calculate the force of the air resistance by multiply the number of coffee filter used with the mass of the coffee and the force of gravity.
After doing the above steps until you have at least 5 terminal velocity and respective force and data points we can do a power fit on the graph, to determine our k and n values. Also we ave uncertainty in our k and n values ( k is A and n is B in the table below) and our y-axis is our force of air resistance and our x-axis is our velocity of the coffee filter
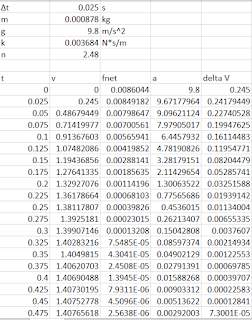
For this part of the lab, we filled out out tables with given values such as n and k values, gravity, mass and change in time. After that we were able to put in formulas in the cells to calculate time, velocity, acceleration and change in velocity. From there we look at where the velocity is close to the velocity we found in Part 1 and record those values.
And do this for each of the respective number of filters.
We later on calculate our percent error by using the percent error formula in the picture above and with our known values for experimental velocity and the true velocity.
I believe our model worked well on getting our velocity values since we were able to get a low percent error of 2%. I believe it may not have worked as we would have liked because there uncertainties not only in the mass but in our k and n values as well. These values will affect our velocity as a result.


No comments:
Post a Comment